DTrace Came to Windows
DTrace is a comprehensive dynamic tracing framework created by Sun Microsystems for troubleshooting kernel and application problems on production systems in real time. Originally developed for Solaris, it has since been released under the free Common Development and Distribution License (CDDL) in OpenSolaris and it’s descendant illumos, and has been ported to several other Unix-like systems.
DTrace can be used to get a global overview of a running system, such as the amount of memory, CPU time, filesystem and network resources used by the active processes. It can also provide much more fine-grained information, such as a log of the arguments with which a specific function is being called, or a list of the processes accessing a specific file.
On March 11th, 2019, Microsoft released their build of DTrace for the Windows 10 insider builds.
Windows DTrace Architecture
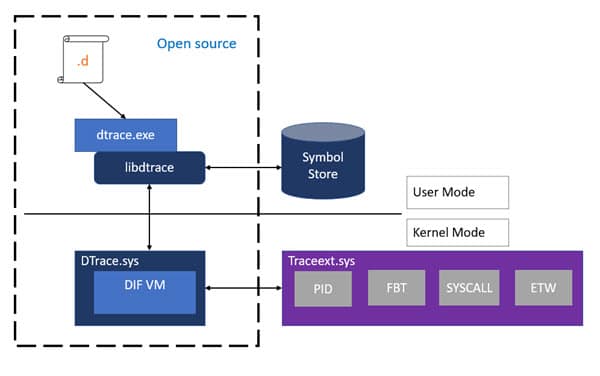
DTrace on Windows is a port of OpenDTrace and reuses much of its user mode components and architecture. Users interact with DTrace through the dtrace command, which is a generic front-end to the DTrace engine. D scripts get compiled to an intermediate format (DIF) in user-space and sent to the DTrace kernel component for execution, sometimes called as the DIF Virtual Machine. This runs in the dtrace.sys driver.
Traceext.sys (trace extension) is a new kernel extension driver we added, which allows Windows to expose functionality that DTrace relies on to provide tracing. The Windows kernel provides callouts during stackwalk or memory accesses which are then implemented by the trace extension. All APIs and functionality used by dtrace.sys are documented calls.
Install and Run DTrace
Prerequisites for using the feature
- Windows 10 insider build 18342 or higher
- Only available on x64 Windows and captures tracing info only for 64-bit processes
- Windows Insider Program is enabled and configured with valid Windows Insider Account
- Visit Settings->Update & Security->Windows Insider Program for details
Instructions:
- BCD configuration set:
- bcdedit /set dtrace on
- Note, you need to set the bcdedit option again, if you upgrade to a new Insider build
- Download and install the DTrace package from download center.
- This installs the user mode components, drivers and additional feature on demand packages necessary for DTrace to be functional.
- Optional: Update the PATH environment variable to include C:\Program Files\DTrace
- set PATH=%PATH%;”C:\Program Files\DTrace”
- Setup symbol path
- Create a new directory for caching symbols locally. Example: mkdir c:\symbols
- Set _NT_SYMBOL_PATH=srv*C:\symbols*http://msdl.microsoft.com/download/symbols
- DTrace automatically downloads the symbols necessary from the symbol server and caches to the local path.
- Optional: Setup Kernel debugger connection to the target machine (MSDN link). This is only required if you want to trace Kernel events using FBT or other providers.
- Note that you will need to disable Secureboot and Bitlocker on C:, (if enabled), if you want to setup a kernel debugger.
- Reboot target machine
Running DTrace
Launch CMD prompt in administrator mode
Get started with sample one-liners:
# Syscall summary by program for 5 seconds:
dtrace -Fn "tick-5sec { exit(0);} syscall:::entry{ @num[pid,execname] = count();} "

# Summarize timer set/cancel program for 3 seconds:
dtrace -Fn "tick-3sec { exit(0);} syscall::Nt*Timer*:entry { @[probefunc, execname, pid] = count();}"

# Dump System Process kernel structure: (requires symbol path to be set)
dtrace -n "BEGIN{print(*(struct nt`_EPROCESS *) nt`PsInitialSystemProcess);exit(0);}"

# Tracing paths through NTFS when running notepad.exe (requires KD attach): Run below command and launch notepad.exe
dtrace -Fn "fbt:ntfs::/execname==\"notepad.exe\"/{}"
The command dtrace -lvn syscall::: will list all the probes and their parameters available from the syscall provider.
The following are some of the providers available on Windows and what they instrument.
- syscall – NTOS system calls
- fbt (Function Boundary Tracing) – Kernel function entry and returns
- pid – User-mode process tracing. Like kernel-mode FBT, but also allowing the instrumentation of arbitrary function offsets.
- etw (Event Tracing for Windows) – Allows probes to be defined for ETW This provider helps to leverage existing operating system instrumentation in DTrace.
- This is one addition we have done to DTrace to allow it to expose and gain all the information that Windows already provides in ETW.
Further Reading
Recommended Settings on Windows 10 for VDI
What’s New Windows Server 2019