Veeam Backup & Replication – Bottleneck Analysis
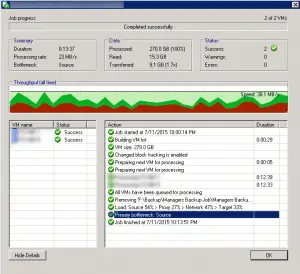
Veeam BR informing you about backup job and backup infrastructure performance when job is finished and you will see a window same as the below:
Load: Source 54% > Proxy 27% > Network 47% > Target 33%
Primary bottleneck: Source
What does it mean?
No matter what job you are running, and how you have the product deployed, there are 4 main data processing stages that data passes in the specific order (think data processing conveyor). These are Source > Proxy > Network > Target, and each processing stage has a load monitoring counter associated with it.
“Source” is the source (production) storage disk reader component. The percent busy number for this component indicates percent of time that the source disk reader spent reading the data from the storage. For example, 99% busy means that the disk reader spent all of the time reading the data, because the following stages are always ready to accept more data for processing. This means that the source data retrieval speed is the bottleneck for the whole data processing conveyor. As opposed to that, 1% busy means that the source disk reader only spent 1% of time actually reading the data (and required data blocks were retrieved very fast), and did nothing the rest of the time, just waiting for the following stages to be able to accept more data for processing (which means that the bottleneck is elsewhere in the data processing conveyor).
“Proxy” is the backup proxy server (source backup proxy in case of replication). Proxy performs on-the-fly deduplication and compression of data received from the source component, which can be quite resource intensive operation on 100MB/s plus data streams. The percent busy number for proxy component shows the proxy CPU load. For example, if proxy shows 99% busy, it means that the proxy CPU is overloaded, and is likely presenting a bottleneck on the whole data processing conveyor.
“Network” is the network queue writer component (with network being Ethernet, or storage network). It gets processed data from the proxy component, and sends it over the network to the target component. The percent busy number for network component shows percent of time that network writer component was busy writing the data into the network stack queue. For example, 99% busy means that the network writer component spends most of the time pushing the data into the network, because there is always some data waiting to be sent over to the target. This means that your network throughtput is insufficient, and is presenting a bottleneck on the whole data processing conveyor.
“Target” is the target (backup/replica storage) disk writer component . The percent busy number for target component shows percent of time that the target disk writer component spent writing the data to the storage. For example, if target shows 99% busy, it means that the target disk writer component spent most of its time performing I/O to backup files. This means your target storage speed is presenting a bottleneck for the whole data processing conveyor, because all the required I/O operations cannot complete fast enough, and due to that there is always some data to write waiting in the incoming queue from the network component.
See this topic from Veeam forum: Link and this video: Link for more information.


