Veeam Backup & Replication – Bottleneck Analysis
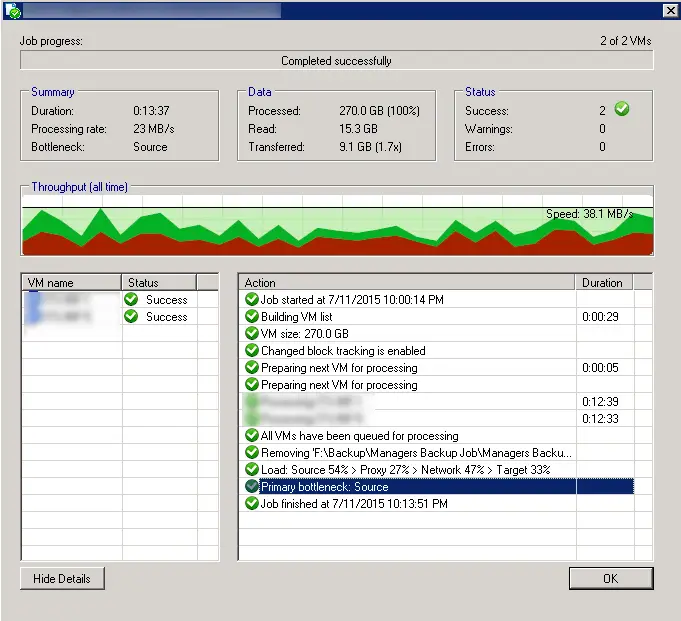
Veeam BR informing you about backup job and backup infrastructure performance when job is finished and you will see a window same as the below: Load: Source 54% > Proxy 27% > Network 47% > Target 33% Primary bottleneck: Source What does it mean? No matter what job you are running, and how you have the product deployed, there are 4 main data processing stages that data passes in the specific order (think data processing conveyor). These are Source > Proxy > Network > Target, and each processing stage has a load monitoring counter associated with it. “Source” is the source (production) storage disk reader component. The percent busy number for this component indicates percent of time that the source disk reader spent reading the data from the storage. For example, 99% busy means that the disk reader spent all of the time reading the data, because the following stages are always ready to accept more data for processing. This means that the source data retrieval speed is the bottleneck for the whole data processing conveyor. As opposed to that, 1% busy means that the source disk reader only spent 1% of time actually reading the data (and required data blocks...


